Business
BHP: The Company is a producer of commodities, including iron ore, copper, nickel, potash, and metallurgical coal. The company's operations are established in Australia, Europe, China, Japan, India, and South Korea, the rest of Asia, North America, and South America.
RIO: The Company owns and operates open-pit and underground mines, mills, refineries, smelters, power stations, and research and service facilities. It also actively involved in diamond mining, sorting, and marketing. It also uses its own railways, ports, and ships to deliver materials.
Market cap
BHP: The market capitalization is $226.52B, where the current market price is $44.69, and there are outstanding shares of 5.07B as of 11 October 2023.
RIO: The market capitalization is $42.40B, the current market price is $114.21, and there are 371.22M outstanding shares as of 11 October 2023.
Dividend yield
BHP: The annual dividend yield is 5.92% as of 11 October 2023.
RIO: The annual dividend yield is 5.23% as of 11 October 2023.
Investor’s return point of view:

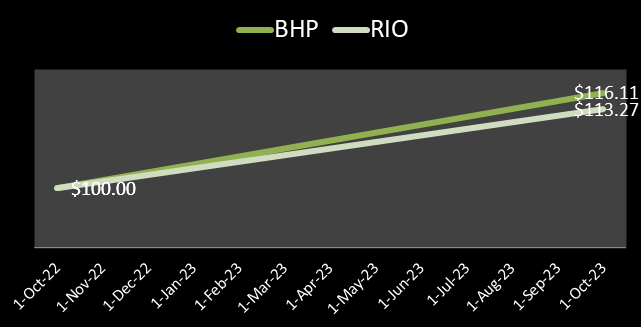
Veye Pty Ltd.: Graphics above: Calculated from 1- year daily data
BHP: A $100 investment in BHP on 10 October 2022 would be worth $116.11 on 9 October 2023. The absolute return generated was 16.11% during the same period.
RIO: An investment of $100 in Rio on 10 October 2022 would value, as of 9 October 2023 $113.27. The absolute return generated was 13.27% during the same period.
5 years compounded annualized return
BHP: The 5 years CAGR return delivered approximately 8.20% (Yield calculated as of 11 October 2023).
RIO: The 5 years CAGR return generated approximately of 8% (Yield calculated as of 11 October 2023).
Systematic risk
BHP: The 5-years average beta is 0.85 <1 of the market volatility. The stock price deviation is quite resilient of market volatility.
RIO: The 5-years average beta value is 0.53 is lower than the standard market beta of 1.
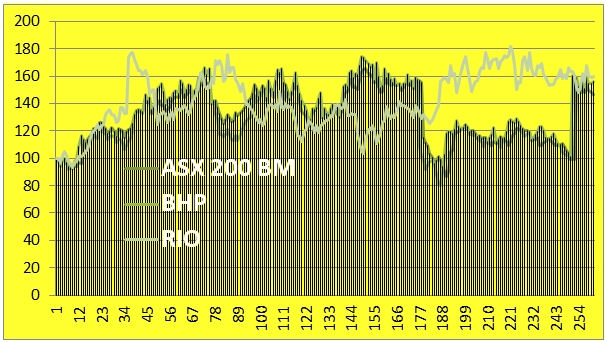
Comparative Analysis: ASX200 Basic Materials, BHP, and RIO

Graphic source: Veye Pty Ltd.
The $100 investment in 14 October 2018 in ASX 200 Basic Materials, BHP, and RIO differs with varied yields such as $146.67, $155.69, and $159.37, respectively, in 8 October 2023.
|
Date
|
ASX200 Basic Materials ($)
|
% Return
|
ASX 200 BM
|
BHP ($)
|
% Return
|
BHP
|
RIO ($)
|
% Return
|
RIO
|
|
10/14/2018
|
11,657.80
|
|
$100
|
28.634
|
|
$100.00
|
71.27
|
|
100
|
|
10/21/2018
|
11,551.20
|
-0.91%
|
$99.09
|
27.874
|
-2.65%
|
$97.35
|
70.87
|
-0.56%
|
$99.44
|
|
10/28/2018
|
11,016.50
|
-4.63%
|
$94.50
|
26.978
|
-3.21%
|
$94.22
|
68.806
|
-2.91%
|
$96.55
|
|
11/4/2018
|
11,572.80
|
5.05%
|
$99.27
|
28.386
|
5.22%
|
$99.13
|
72.704
|
5.67%
|
$102.02
|
|
2/12/2023
|
14,159.60
|
1.15%
|
$121.46
|
33.933
|
-4.49%
|
$118.51
|
122.01
|
10.27%
|
$171.20
|
|
2/19/2023
|
14,050.70
|
-0.77%
|
$120.53
|
33.15
|
-2.31%
|
$115.77
|
124.02
|
1.65%
|
$174.02
|
|
2/26/2023
|
13,999.40
|
-0.37%
|
$120.09
|
33.746
|
1.80%
|
$117.85
|
117.15
|
-5.54%
|
$164.38
|
|
3/5/2023
|
13,852.90
|
-1.05%
|
$118.83
|
34.165
|
1.24%
|
$119.32
|
126.14
|
7.67%
|
$177.00
|
|
3/12/2023
|
13,170.70
|
-4.92%
|
$112.98
|
32.615
|
-4.54%
|
$113.90
|
117.87
|
-6.56%
|
$165.39
|
|
6/4/2023
|
12,722.70
|
-1.44%
|
$109.13
|
32.811
|
-3.03%
|
$114.59
|
112
|
2.28%
|
$157.16
|
|
6/11/2023
|
12,741.00
|
0.14%
|
$109.29
|
31.752
|
-3.23%
|
$110.89
|
113.26
|
1.13%
|
$158.92
|
|
9/24/2023
|
17,386.70
|
-3.06%
|
$149.14
|
44.2
|
-3.09%
|
$154.36
|
114.15
|
-4.32%
|
$160.17
|
|
10/1/2023
|
17,218.90
|
-0.97%
|
$147.70
|
44.25
|
0.11%
|
$154.54
|
113.16
|
-0.87%
|
$158.78
|
|
10/8/2023
|
17,098.10
|
-0.70%
|
$146.67
|
44.58
|
0.75%
|
$155.69
|
113.58
|
0.37%
|
$159.37
|
Fig: - Comparative analysis of ASX 200 Basic Materials, BHP, and RIO.5-year's weekly data taken to conclude the assumption.
Graphic Source: Veye Pty Ltd.
The previous 5 years of weekly data represented a co-relation between ASX 200 basic materials and the BHP of 23%, while the co-relation value was derived as meagerly at -2.1% in the case of RIO. That means RIO businesses are negatively related to sectoral businesses. At the same time, stakeholder return-generating potential stands out as more competitive compared to others.
Comparison on the basis of fundamentals:

Graphic Source: Refinitiv,
The comparable revenues and gross profit have a marginal difference between BHP and RIO. The operating profit in RIO is comparatively lower on account of higher non-cash expenses; however, the bottom line gains are relatively close. The dividend per share is higher in the case of RIO. The RIO is building up a huge capex base; consequently, the free cash flows are negative. Investors may find real value down the line when the RIO’s acquired assets would start materializing in real revenue figures. BHP is a bigger company than RIO. It is interesting to see that the RIO is equating BHP in efficient utilization of its assets. The ROA’s are very close to each other. ROE is also comparably nearby. The enterprise value is significantly higher in the case of BHP due to its higher market cap and debt level.
Sectoral Analysis
|
Matrices
|
Sectoral Median
|
BHP
|
RIO
|
|
PE
|
9.6
|
11.26
|
9.6
|
|
EPS
|
-2.88
|
3.82
|
11.19
|
|
Quick ratio
|
1.37
|
0.95
|
1.1
|
|
Current ratio
|
2.85
|
1.23
|
1.64
|
|
LT Debt/Equity ratio
|
1.47
|
34.1
|
21.84
|
|
LT Debt/Capital ratio
|
1.87
|
21.41
|
17.01
|
|
Price/Sales
|
15.63
|
2.71
|
1.89
|
|
Price/Book value
|
3.17
|
3.28
|
2.07
|
|
EV/EBITDA (LTM)
|
N/A
|
3.92
|
5.15
|
|
|
|
|
|
Graphic Source: Refinitiv,
The PE multiples of RIO trade more competitively as the earnings growth is much faster than the whole sector, and also from a relative valuation perspective, they are more lucrative than BHP. From the quick and current ratio values, it’s evident that RIO has a better inventory management strategy because of its relatively stronger ability to pay short-term liabilities. These companies belong to capital-intensive industries; so therefore, higher debt levels are quite natural for the basic materials industry, although RIO has relatively better coverage ratios than BHP. Price-to-sales and price-to-book value trades are relatively cheaper in RIO compared with the whole sector and BHP as well. From a valuation perspective, EV/EBITDA multiples and higher EPS than PE suggest a better value proposition for the common shareholders than BHP.
Veye Pty Ltd(ABN 58 623 120 865), holds (AFSL No. 523157 ). All information provided by Veye Pty Ltd through its website, reports, and newsletters is general financial product advice only and should not be considered a personal recommendation to buy or sell any asset or security. Before acting on the advice, you should consider whether it’s appropriate to you, in light of your objectives, financial situation, or needs. You should look at the Product Disclosure Statement or other offer document associated with the security or product before making a decision on acquiring the security or product. You can refer to our Terms & Conditions and Financial Services Guide for more information. Any recommendation contained herein may not be suitable for all investors as it does not take into account your personal financial needs or investment objectives. Although Veye takes the utmost care to ensure accuracy of the content and that the information is gathered and processed from reliable resources, we strongly recommend that you seek professional advice from your financial advisor or stockbroker before making any investment decision based on any of our recommendations. All the information we share represents our views on the date of publishing as stocks are subject to real time changes and therefore may change without notice. Please remember that investments can go up and down and past performance is not necessarily indicative of future returns. We request our readers not to interpret our reports as direct recommendations. To the extent permitted by law, Veye Pty Ltd excludes all liability for any loss or damage arising from the use of this website and any information published (including any indirect or consequential loss, any data loss, or data corruption) (as mentioned on the website www.veye.com.au), and confirms that the employees and/or associates of Veye Pty Ltd do not hold positions in any of the financial products covered on the website on the date of publishing this report. Veye Pty Ltd hereby limits its liability, to the extent permitted by law to the resupply of services.