ASX 50 Companies: Australia's Top Stocks - Latest News, Analysis & Insights

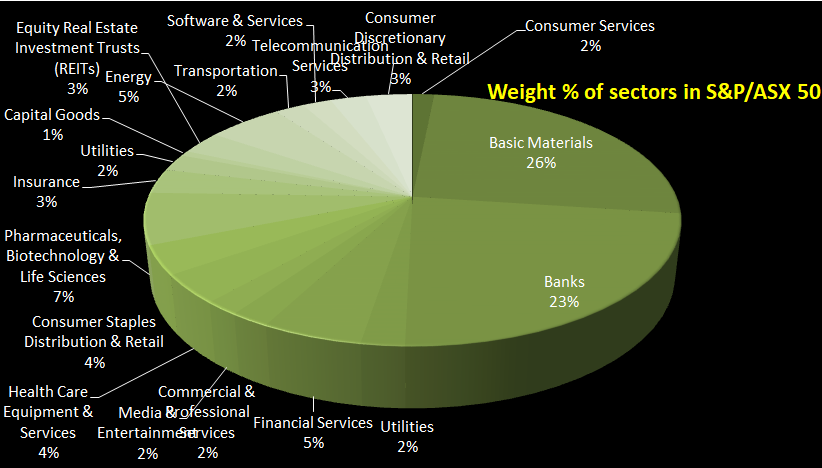
The S&P/ASX 50 (XFL) index comprises Australia's 50 largest-capitalization companies, which are basically the biggest national and multinational ASX-listed companies. The constituents under the index account for approximately 62% (as of September 2023) of Australia’s share market capitalization. The ASX 50 index is basically diversified between 10 GICS sectors. The consumer discretionary sector is the only one not in the loop. Currently, there is one exchange-traded fund (ETF) that normally tracks the performance of the index: SPDR S&P/ASX 50 Fund (SFY).

Fig.: 5-year monthly data simulation
Source: Veye Pty Limited.
The market data reported for S&P/ASX50 is 6748.9 points as of October 2023. The 5-year compounded annual growth rate (CAGR) of the index is 4.03% (yield as of 25 Oct 2023). The absolute return produced in a 1-year period is 1.91% (yield as of 25 Oct 2028). The CAGR return of the index in the last 20 years was 3.71% (yield as of 25 October 2023), and the absolute return produced during these 20 years was 107.38% (yield as of 25 October 2023). The index touched an all-time high in January 2023 of 7312 points. The constituents of the index are reviewed quarter-on-quarter using the previous six months of data. The index forms the basis for the SPDR S&P/ASX 50 exchange-traded fund (ETF).

Fig.: 5-year monthly data simulation
Source: Veye Pty Limited.
The $100 investment in S&P/ASX50 five years ago produced a yield of approximately 21.50% today.
|
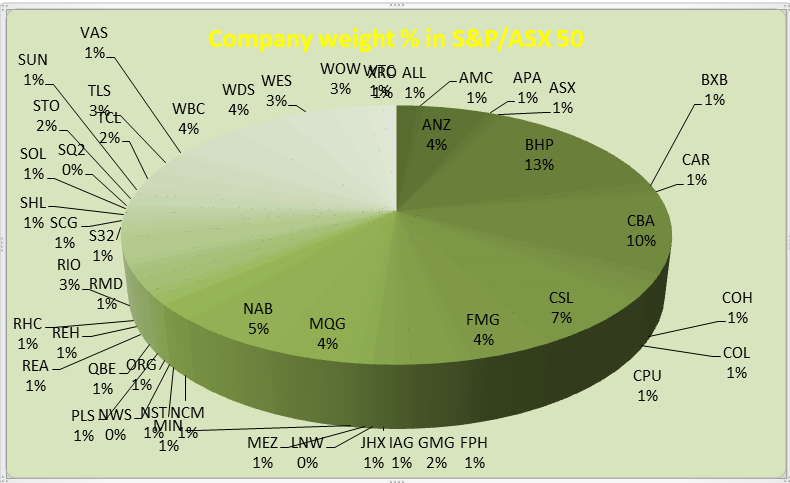
TOP 50 BY MARKET CAP (As of 26 October 2023) |
Weight (%) |
||
|
CODE / COMPANY NAME |
INDUSTRY |
MARKET CAP ($,Billion) |
|
|
ALL |
Consumer Services |
24.91 |
1.48% |
|
ARISTOCRAT LEISURE LIMITED |
|||
|
AMC |
Basic Materials |
8.66 |
0.51% |
|
AMCOR PLC |
|||
|
ANZ |
Banks |
74.26 |
4.42% |
|
ANZ GROUP HOLDINGS LIMITED |
|||
|
APA |
Utilities |
10.36 |
0.62% |
|
APA GROUP |
|||
|
ASX |
Financial Services |
10.69 |
0.64% |
|
ASX LIMITED |
|||
|
BHP |
Materials |
227 |
13.50% |
|
BHP GROUP LIMITED |
|||
|
BXB |
Commercial & Professional Services |
19.49 |
1.16% |
|
BRAMBLES LIMITED |
|||
|
CAR |
Media & Entertainment |
10.46 |
0.62% |
|
CARSALES.COM LIMITED. |
|||
|
CBA |
Banks |
162.19 |
9.64% |
|
COMMONWEALTH BANK OF AUSTRALIA. |
|||
|
COH |
Health Care Equipment & Services |
15.89 |
0.94% |
|
COCHLEAR LIMITED |
|||
|
COL |
Consumer Staples Distribution & Retail |
20.08 |
1.19% |
|
COLES GROUP LIMITED. |
|||
|
CPU |
Commercial & Professional Services |
14.86 |
0.88% |
|
COMPUTERSHARE LIMITED. |
|||
|
CSL |
Pharmaceuticals, Biotechnology & Life Sciences |
112.53 |
6.69% |
|
CSL LIMITED |
|||
|
FMG |
Materials |
68.06 |
4.05% |
|
FORTESCUE METALS GROUP LTD |
|||
|
FPH |
Health Care Equipment & Services |
11.06 |
0.66% |
|
FISHER & PAYKEL HEALTHCARE CORPORATION LIMITED |
|||
|
GMG |
Equity Real Estate Investment Trusts (REITs) |
38.16 |
2.27% |
|
GOODMAN GROUP |
|||
|
IAG |
Insurance |
13.79 |
0.82% |
|
INSURANCE AUSTRALIA GROUP LIMITED |
|||
|
JHX |
Materials |
16.79 |
1.00% |
|
JAMES HARDIE INDUSTRIES PLC |
|||
|
LNW |
Consumer Services |
1.72 |
0.10% |
|
LIGHT & WONDER INC. |
|||
|
MEZ |
Utilities |
11.67 |
0.69% |
|
MERIDIAN ENERGY LIMITED |
|||
|
MIN |
Materials |
11.57 |
0.69% |
|
MINERAL RESOURCES LIMITED |
|||
|
MQG |
Financial Services |
62.39 |
3.71% |
|
MACQUARIE GROUP LIMITED |
|||
|
NAB |
Banks |
88.16 |
5.24% |
|
NATIONAL AUSTRALIA BANK LIMITED |
|||
|
NCM |
Materials |
20.75 |
1.23% |
|
NEWCREST MINING LIMITED |
|||
|
NST |
Materials |
13.66 |
0.81% |
|
NORTHERN STAR RESOURCES LTD |
|||
|
NWS |
Media & Entertainment |
1 |
0.06% |
|
NEWS CORPORATION.. |
|||
|
ORG |
Utilities |
15.7 |
0.93% |
|
ORIGIN ENERGY LIMITED |
|||
|
PLS |
Materials |
11.54 |
0.69% |
|
PILBARA MINERALS LIMITED |
|||
|
QBE |
Insurance |
23.14 |
1.38% |
|
QBE INSURANCE GROUP LIMITED |
|||
|
REA |
Media & Entertainment |
19.34 |
1.15% |
|
REA GROUP LTD |
|||
|
REH |
Capital Goods |
11.27 |
0.67% |
|
REECE LIMITED |
|||
|
RHC |
Health Care Equipment & Services |
11.21 |
0.67% |
|
RAMSAY HEALTH CARE LIMITED |
|||
|
RIO |
Materials |
43.5 |
2.59% |
|
RIO TINTO LIMITED |
|||
|
RMD |
Health Care Equipment & Services |
11.64 |
0.69% |
|
RESMED INC |
|||
|
S32 |
Materials |
14.69 |
0.87% |
|
SOUTH32 LIMITED |
|||
|
SCG |
Equity Real Estate Investment Trusts (REITs) |
12.51 |
0.74% |
|
SCENTRE GROUP |
|||
|
SHL |
Health Care Equipment & Services |
13.5 |
0.80% |
|
SONIC HEALTHCARE LIMITED |
|||
|
SOL |
Financial Services |
12.25 |
0.73% |
|
WASHINGTON H SOUL PATTINSON & COMPANY LIMITED |
|||
|
SQ2 |
Financial Services |
2.15 |
0.13% |
|
BLOCK INC. |
|||
|
STO |
Energy |
25.33 |
1.51% |
|
SANTOS LIMITED |
|||
|
SUN |
Insurance |
17.11 |
1.02% |
|
SUNCORP GROUP LIMITED |
|||
|
TCL |
Transportation |
36.16 |
2.15% |
|
TRANSURBAN GROUP |
|||
|
TLS |
Telecommunication Services |
44.02 |
2.62% |
|
TELSTRA GROUP LIMITED |
|||
|
VAS |
Not Applic |
12.71 |
0.76% |
|
VANGUARD AUSTRALIAN SHARES INDEX ETF |
|||
|
WBC |
Banks |
72.22 |
4.29% |
|
WESTPAC BANKING CORPORATION |
|||
|
WDS |
Energy |
66.04 |
3.93% |
|
WOODSIDE ENERGY GROUP LTD |
|||
|
WES |
Consumer Discretionary Distribution & Retail |
57.05 |
3.39% |
|
WESFARMERS LIMITED |
|||
|
WOW |
Consumer Staples Distribution & Retail |
43.06 |
2.56% |
|
WOOLWORTHS GROUP LIMITED |
|||
|
WTC |
Software & Services |
19.52 |
1.16% |
|
WISETECH GLOBAL LIMITED |
|||
|
XRO |
Software & Services |
15.9 |
0.95% |
|
XERO LIMITED |
|||
|
Total Market cap |
|
1681.72 |
100.00% |
Source: Veye Pty Limited
Source: Veye Pty Limited
How are ASX 50 companies selected?
The S&P/ASX 50 Index is a stock market index of Australian stocks listed on the Australian securities exchange by Standard & Poor’s. It is a part of the S&P Global 1200. The top 50 largest market capitalization companies are the constituents of the index. The S&P/ASX 50 Index is calculated by using the S&P Dow Jones Indices market capitalization-weighted and float-adjusted methodologies. All companies under the index are featured in the S&P/ASX 200 as well.
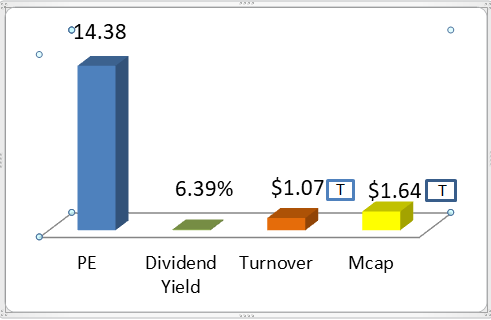
PE Ratio, Dividend Yield, Turnover, and M Cap
Fundamental data for the S&P/ASX 50 Index is weighted average by market capitalization. Mcap values and turnover numbers are in trillions.
Data updated 27 October 2023
Source: Veye Pty Limited
Frequently Asked Questions (F.A.Q)
What is ASX 50?
The S&P/ASX 50 (XFL) index comprises Australia's 50 largest-capitalization companies, which are basically the biggest national and multinational ASX-listed companies.
What is the difference between ASX 50 and ASX 100?
ASX50 comprises the top 50 largest companies as a constituent of the index on the basis of float-adjusted market capitalization and accounts for approximately 62% of Australia’s equity market as of September 2023. The S&P/ASX100 (XTO) represents Australia’s large and mid-cap companies. The index comprises 100 top market-capitalization companies on the basis of float-adjusted. The index accounts for approximately 73% of Australia’s equity market as of September 2023.
What is the exchange traded fund (ETF) under S&P/ASX50?
PDR S&P/ASX 50 Fund (ASX: SFY) is an exchange traded managed fund that tracks the S&P/ASX 50 ads represented under the index. The responsible entity of the fund is the ’State Street Global Advisors’.. The 5-year compounded annual growth rate of the fund is approximately 2.83%.
Does ASX 50 pay dividends?
The ASX50 annual dividend yield percentage was 6.39, updated on 27 October 2023.
Get Your Free Report on Top 5 ASX Stocks on WhatsApp
Instant Access. No Credit Card Required.
Receive on WhatsAppCheckout Our Recommendation for free - 7 days free trial
Start Free TrialASX Stock Research & Recommendations — 7‑day free trial
Independent, analyst‑driven insights.
- Stock of the week report
- Daily Analysis Report
- No credit card required
Get Your FREE Report
Discover the Top ASX Stocks to Invest In 2026!
Expert Analysis of Top-Performing ASX Stocks
Market Insights and In-Depth Research
Buy, Sell, And Hold Recommendations
Almost There!
Enter your details to download the report
Success!
Preparing your download...
Latest Article


Disclaimer
Veye Pty Ltd(ABN 58 623 120 865), holds (AFSL No. 523157 ). All information provided by Veye Pty Ltd through its website, reports, and newsletters is general financial product advice only and should not be considered a personal recommendation to buy or sell any asset or security. Before acting on the advice, you should consider whether it’s appropriate to you, in light of your objectives, financial situation, or needs. You should look at the Product Disclosure Statement or other offer document associated with the security or product before making a decision on acquiring the security or product. You can refer to our Terms & Conditions and Financial Services Guide for more information. Any recommendation contained herein may not be suitable for all investors as it does not take into account your personal financial needs or investment objectives. Although Veye takes the utmost care to ensure accuracy of the content and that the information is gathered and processed from reliable resources, we strongly recommend that you seek professional advice from your financial advisor or stockbroker before making any investment decision based on any of our recommendations. All the information we share represents our views on the date of publishing as stocks are subject to real time changes and therefore may change without notice. Please remember that investments can go up and down and past performance is not necessarily indicative of future returns. We request our readers not to interpret our reports as direct recommendations. To the extent permitted by law, Veye Pty Ltd excludes all liability for any loss or damage arising from the use of this website and any information published (including any indirect or consequential loss, any data loss, or data corruption) (as mentioned on the website www.veye.com.au), and confirms that the employees and/or associates of Veye Pty Ltd do not hold positions in any of the financial products covered on the website on the date of publishing this report. Veye Pty Ltd hereby limits its liability, to the extent permitted by law to the resupply of services.