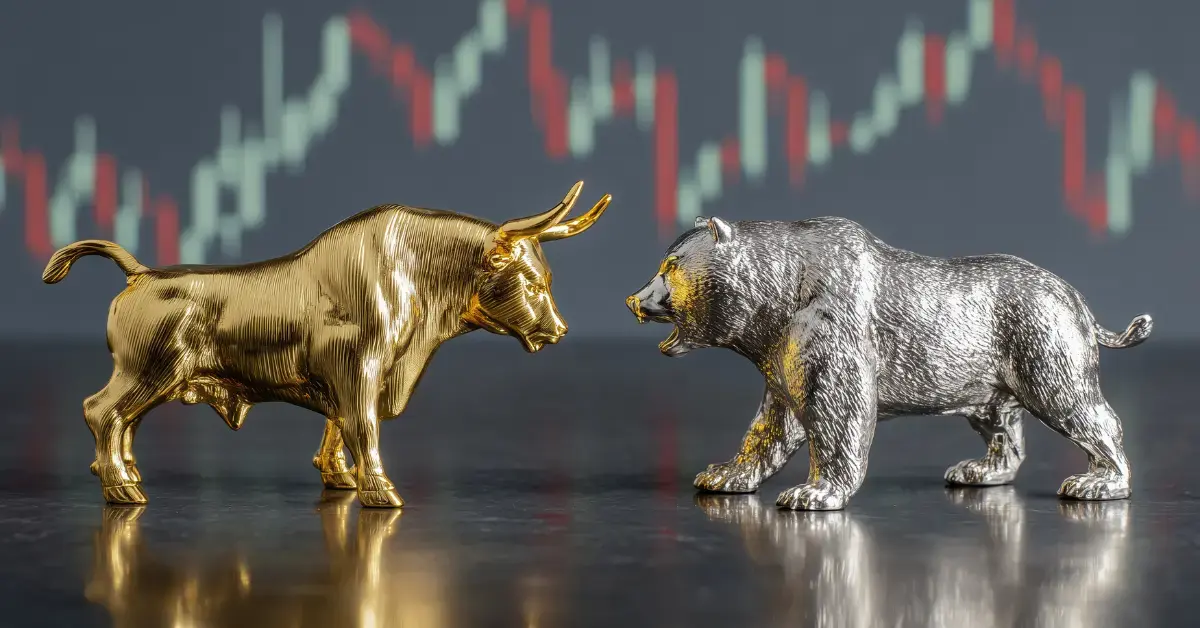
Stocks and Bonds are showing strange trends-Is history repeating itself?

Stock market crashes are social phenomena where external economic events combine with crowd behaviour and psychology in a positive feedback loop where selling by some market participants drives more market participants to sell. There are known conditions that instigate these crashes:
1.A prolonged period of rising stock prices
2.Excessive economic optimism
3.A market where P/E ratios exceed long-term averages
4.And, extensive use of margin debt and leverage by market participants.
Other aspects like wars, large-corporation hacks, changes in federal laws and regulations, and natural disasters of highly economically productive areas may also influence a significant decline in the NYSE value of a wide range of stocks. All such stock drops may result in the rise of stock prices for corporations competing against the affected corporations
One of such major stock market crash took place on 19th Oct 1987 known as the Black Monday in the history of the Stock Market. Although the reasons are still not known, but the conditions were very similar to what has been stated above. The time period experienced strong economic optimism. From August 1982 to its peak in August 1987, the Dow Jones grew from 776 to 2722. The rise in market indices for the 19 largest markets in the world averaged 296% during this period. The average number of shares traded on the NYSE had risen from 65 million shares to 181 million shares.
The crash on October 19, 1987, a date that is also known as Black Monday, was the culmination of a market decline that had started five days before on October 14. Dow Jones fell 3.81% on October 14, followed by another 4.60% drop on Friday, October 16. On Black Monday, the Dow Jones Industrials Average plummeted 508 points, losing 22.6% of its value in one day. The S&P 500 dropped 20.4%, falling from 282.7 to 225.06. The NASDAQ Composite lost only 11.3%, not because of restraint on the part of sellers, but because the NASDAQ market system failed. Deluged with sell orders, many stocks on the NYSE faced trading halts and delays. Trading in many stocks encountered a pathological condition where the bid price for a stock exceeded the ask price. These "locked" conditions severely curtailed trading. (Source – Wikipedia)
The Crash was the greatest single-day loss that Wall Street had ever suffered in continuous trading up to that point. Between the start of trading on October 14 to the close on October 19, Dow Jones lost 760 points, a decline of over 31%.
The 1987 Crash had a ripple effect worldwide. The FTSE 100 Index lost 10.8% on that Monday and a further 12.2% the following day. In the month of October, all major world markets declined substantially.
Surprisingly, the market rallied immediately after the crash, posting a record one-day gain of 102.27 the very next day and 186.64 points on Thursday October 22. It took only two years for the Dow Jones to recover completely; by September 1989, the market had regained all of the value it had lost in the 1987 crash.
The recent Dow Jones crash seems to be strengthening the quote “History repeats itself”. There was a bloodbath at Dow Jones last week In percentage, that was a steep drop of 4.6%, taking it down to 24,346 points. At its worst, the Dow fell by more than 1,500 points overnight.
When last Friday's results are included, the blue-chip index has plunged by more than 1,800 points in two days — erasing all its 2018 gains. The previous biggest drop in points was during the global financial crisis, when it fell 778 points in September 2008. The US market wipe-out was sparked by a fast rise in interest rates, with US 10-year bond yields reaching a four-year high. The sell-off extended to the broader S&P 500 which fell by 113 points (or 4.1 per cent) to 2,649. NASDAQ fell 3.8% to close at 6,968.
It is time to learn from the past and be very cautious while trading as this may not be the end of the bloodbath. The circumstances are very similar to the one’s that existed in 1987. Who knows there’s more in store that is yet to unveil?
Get Your Free Report on Top 5 ASX Stocks on WhatsApp
Instant Access. No Credit Card Required.
Receive on WhatsAppCheckout Our Recommendation for free - 7 days free trial
Start Free TrialASX Stock Research & Recommendations — 7‑day free trial
Independent, analyst‑driven insights.
- Stock of the week report
- Daily Analysis Report
- No credit card required
Get Your FREE Report
Discover the Top ASX Stocks to Invest In 2026!
Expert Analysis of Top-Performing ASX Stocks
Market Insights and In-Depth Research
Buy, Sell, And Hold Recommendations
Almost There!
Enter your details to download the report
Success!
Preparing your download...
Latest Article


Disclaimer
Veye Pty Ltd(ABN 58 623 120 865), holds (AFSL No. 523157 ). All information provided by Veye Pty Ltd through its website, reports, and newsletters is general financial product advice only and should not be considered a personal recommendation to buy or sell any asset or security. Before acting on the advice, you should consider whether it’s appropriate to you, in light of your objectives, financial situation, or needs. You should look at the Product Disclosure Statement or other offer document associated with the security or product before making a decision on acquiring the security or product. You can refer to our Terms & Conditions and Financial Services Guide for more information. Any recommendation contained herein may not be suitable for all investors as it does not take into account your personal financial needs or investment objectives. Although Veye takes the utmost care to ensure accuracy of the content and that the information is gathered and processed from reliable resources, we strongly recommend that you seek professional advice from your financial advisor or stockbroker before making any investment decision based on any of our recommendations. All the information we share represents our views on the date of publishing as stocks are subject to real time changes and therefore may change without notice. Please remember that investments can go up and down and past performance is not necessarily indicative of future returns. We request our readers not to interpret our reports as direct recommendations. To the extent permitted by law, Veye Pty Ltd excludes all liability for any loss or damage arising from the use of this website and any information published (including any indirect or consequential loss, any data loss, or data corruption) (as mentioned on the website www.veye.com.au), and confirms that the employees and/or associates of Veye Pty Ltd do not hold positions in any of the financial products covered on the website on the date of publishing this report. Veye Pty Ltd hereby limits its liability, to the extent permitted by law to the resupply of services.