The Current Market Reality And The Road Ahead For ASX 200 Investors
What is the current stock market reality and the road ahead for ASX 200 investors?
The US market sets the tone for the worldwide equity markets. It has technically entered a bear market after the sharp fall in recent months. A market is said to have entered the bear phase when it has corrected by at least 20% from its recent high. The S&P 500 has corrected more than 20% whereas the tech-heavy NASDAQ has corrected more than 30% from their recent high levels. Even though the ASX 200 has corrected just over 12% from its recent high of 7,632.8, there is a sense of panic among retail investors.
The fall in the market is mainly because of drying up of liquidity. According to Christian Hoffman, a portfolio manager for Thornburg Investment, “Liquidity in the market is worse than it was leading up to Lehman,” said Hoffman,
Now the question is what is really happening and what is the way ahead?
A unique phenomenon
World-wide, the market experienced a sudden crash on the onset of COVID-19, a once in a 100 years pandemic. However, the market recovered pretty fast and regained the lost value in a matter of few months. In the next one and half years, the global market experienced a phenomenal bull-market driven by high-liquidity and never seen before retail participation. Stocks of average and even questionable fundamentals rose rapidly due to speculative activities, mostly by new investors. It almost became a written rule that the market only goes up and never goes down. The ASX 200 rose to 7,632.8 2021 from its pandemic low of 4402.5 in about 18 months. That was a whopping rise of 73.37%.
When the market goes up at such a rapid rate, it must correct significantly. This has been shown time and again in the history of the stock market. The historical inflation-adjusted return from equity is around 10%. So, when the market goes up at a much higher rate for a certain period, it is given that the market will underperform in other times to maintain the historical average. In simple words, this is the law of average in the equity market.
The recent sharp correction in the equity market has been majorly contributed by a mass exit of retail traders – the same people who were behind the furious rise. According to research by Goldman Sachs Group Inc., around 50% of single-stock retail positions in the Nasdaq and 25% of single-stock retail positions in S&P 500 that was accumulated in the last 3 years by retail investors have been sold.
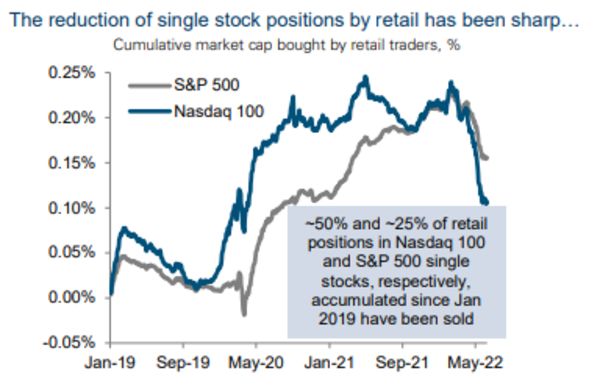
Source: Goldman Sachs
Moreover, there is a reversal in call options volume of about 70% from January 2019 to November 2021. According to John Marshall, Goldman Sachs, “While historically retail investors have bought the dip, this time they haven’t,”

Source: Goldman Sachs
We should not forget the fact that U.S. stocks, even after the ongoing routs, is up 13% annually in the past decade. While the high-risk taking retail investors exit the market, the wise and systematic investors will thrive in the long-run.
Is the market overreacting the recession fear?
High inflation has been the theme of the equity market for quite some time. Faced by the highest inflation in about 40 years, the Fed decided to increase the interest rate by 75 basis points in its latest policy meet. The sharper than expected rate hike is a result of a strong reaction by the Fed facing a consumer inflation rate of 8.6% in May 2022.
Higher interest rates make it costlier for firms to borrow and invest. Also, when the interest rate is high, consumers prefer to save more and spend less. The combined effects result in lower sales by firms and a higher unemployment level. This is when the economy lands up in a recession. Recession leads to downgrades of earnings by firms as they face a negative business prospect.
It is too early to say whether the US economy would face a recession as predicted by many economists. However, the Fed is still hopeful of a rising GDP in the current and next fiscal. In the last policy statement, the Fed reiterate the fact that US economy is in a solid footing, the demand is strong and the unemployment rate is low. According to Fed Chairman Jerome Powell, “There’s no sign of a broader slowdown that I can see in the economy.”
When can we expect the turnaround?
History repeats itself but never in the exact same manner. Predicting the moves in the market in the exact way is an impossible task. However, if we want to have an idea of the next probable moves of the market, history is our only guide.
According to a study by Michael Hartnett of the Bank of America, there is around 37% loss in the S&P 500 in an average bear market and the duration of an average bear market in S&P 500 is around 9 months. Going by the same pattern, we can expect the bottom of the market to be reached by around October 2022. However, there is no fixed rules as bear markets come in all shapes and sizes. The last bear market caused by the global financial crisis starting from 2008 lasted for about 18 months.
It is the US market that works as a primary indicator for the performance of stocks market worldwide, we can expect a similar timeline for the turnaround in the ASX 200. Since 1970, the ASX 200 has suffered 11 bear markets with an average length of 13 months and an average loss of 35.8%. Given by this historical average, the ASX 200 should bounce back the end of this year or early next year.
Some positive signs of structural changes in investment
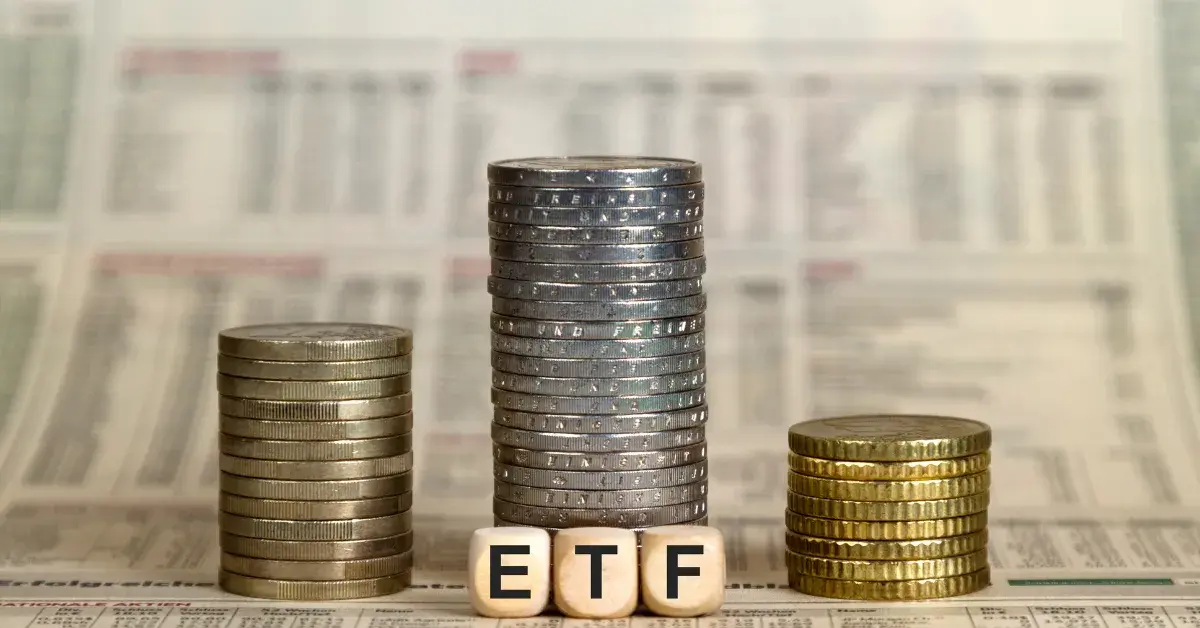
Even though there is fall in single stock ownership by retail investors, they have been actively investing in exchange-traded funds; especially the ones giving high dividends. This shows a positive structural trend and a shift towards systematic investment from speculative investment. According to a study by Goldman Sachs, there has been inflows of around $30 billion in such finds in 2022 itself.
This is a healthy trend in terms of long-term equity investment. Jane Edmondson, CEO and founder of EQM Capital says “There has been a regime shift from the old FAANG megatech names to more defensive, income plays,” Such a trend is beneficial for the market because it lowers speculative activities and market volatility.
Road – ahead: systematic buying and discipline
Around seven decades ago legendary investor Benjamin Graham popularized the concept of dollar-cost averaging. This is a systematic investment tool in which an investor invests a fixed amount of money in certain interval (for example, $1000 every month) rather than investing all the available funds at one go.
Through the dollar-cost averaging, one does not need to worry even if the market is in a downward slope in the short-term. When the market trajectory changes and the bull-phase begins, a long-term investor can earn high returns from the invested funds. Investors who invest at one go are more likely to panic and exit the market in a bear phase. A systematic investor who invests a small amount at periodic intervals is not much affected by the market fluctuations.
Remember when the market falls, it provides the long-term value investors with an opportunity to buy valuable assets at a cheaper price. According to investment legend Warren Buffet, “only those who will be sellers of equities in the near future should be happy at seeing stocks rise, prospective purchasers should much prefer sinking prices.”
Get Your Free Report on Top 5 ASX Stocks on WhatsApp
Instant Access. No Credit Card Required.
Receive on WhatsAppCheckout Our Recommendation for free - 7 days free trial
Start Free TrialASX Stock Research & Recommendations — 7‑day free trial
Independent, analyst‑driven insights.
- Stock of the week report
- Daily Analysis Report
- No credit card required
Get Your FREE Report
Discover the Top ASX Stocks to Invest In 2026!
Expert Analysis of Top-Performing ASX Stocks
Market Insights and In-Depth Research
Buy, Sell, And Hold Recommendations
Almost There!
Enter your details to download the report
Success!
Preparing your download...
Latest Article


Disclaimer
Veye Pty Ltd(ABN 58 623 120 865), holds (AFSL No. 523157 ). All information provided by Veye Pty Ltd through its website, reports, and newsletters is general financial product advice only and should not be considered a personal recommendation to buy or sell any asset or security. Before acting on the advice, you should consider whether it’s appropriate to you, in light of your objectives, financial situation, or needs. You should look at the Product Disclosure Statement or other offer document associated with the security or product before making a decision on acquiring the security or product. You can refer to our Terms & Conditions and Financial Services Guide for more information. Any recommendation contained herein may not be suitable for all investors as it does not take into account your personal financial needs or investment objectives. Although Veye takes the utmost care to ensure accuracy of the content and that the information is gathered and processed from reliable resources, we strongly recommend that you seek professional advice from your financial advisor or stockbroker before making any investment decision based on any of our recommendations. All the information we share represents our views on the date of publishing as stocks are subject to real time changes and therefore may change without notice. Please remember that investments can go up and down and past performance is not necessarily indicative of future returns. We request our readers not to interpret our reports as direct recommendations. To the extent permitted by law, Veye Pty Ltd excludes all liability for any loss or damage arising from the use of this website and any information published (including any indirect or consequential loss, any data loss, or data corruption) (as mentioned on the website www.veye.com.au), and confirms that the employees and/or associates of Veye Pty Ltd do not hold positions in any of the financial products covered on the website on the date of publishing this report. Veye Pty Ltd hereby limits its liability, to the extent permitted by law to the resupply of services.